
2012 ACM ICPC South Central USA Regional Programming Contest
1 - Bollinger Bands
For finding the lost continent of Atlantis, you have been given a large sum of money. Naturally, you want to maximize your money potential through the stock market and logically Bollinger Bands are the best way to go. You will watch the trends using Bollinger Bands and when the time is right you will invest all of your money. The first thing you have to do is construct a program to tell you when to buy or sell to make the most of your capital.
The purpose of the Bollinger Bands is to provide a relative definition of high and low. By definition, prices are high at the upper band and low at the lower band. This definition can aid in rigorous pattern recognition and is useful in comparing price action to the action of indicators to arrive at systematic trading decisions.
Some terms you need for the program:
- A = amount of money you have been given
- N = number of samples
- K = abitrary number picked for the Bollinger Bands
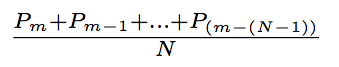
- Simple Moving Average (SMA) =
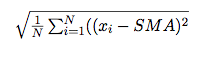
- Sigma (Population formula) = Standard deviation of SMA =
- UpperBand = SMA + K * Sigma
- LowerBand = SMA - K * Sigma
- End of Day Stock Quote = The price the stock closed at.
For this exercise we will use stock quotes in the form of "ACME 08/17/012 677.14". A stock quote will consist of a stock name, followed by a date, followed by a price. The name is a string of 1-4 uppercase characters. The date has the format mm/dd/yyy where mm is the two-digit month (starting at 01 for January), dd is the two-digit day of the month (starting at 01), and yyy are the last three digits of the year (e.g. 012 for 2012). The price is a floating-point number in the range of $1.00 to $2000.00. The fields are separated by single spaces:
XXXX mm/dd/yyy 9999999.99
The buy indicator is when the stock quote drops below the bottom Bollinger band. The sell indicator is when the stock quote rises above the top Bollinger band. Buying and selling is done with the closing stock price for the day you are buying or selling. Once you have bought, you cannot buy again until you have sold. The model needs some time to "warm-up", so you cannot start buying and selling until you have read at least N samples.
At the end of the simulation, if you are in the "holding stocks state", you print out the value of your stock. If you are in the "looking to buy state" you print out the amount of money you have.
Input:
C (number of cases in dataset)K (number to use for upper & lower bands)
N (number of samples of each stock for warmup/size moving average. It doesn't make sense to start using the moving average until you have read in at least the size of it)
D (Number of days in the simulation)
A = amount of money (floating point) that you have been given to start with
stock, mm/dd/yyy, price 1
stock, mm/dd/yyy, price 2
.
.
.
stock, mm/dd/yyy, price N
D (number of days of end of day stock quotes for the stocks)
stock, mm/dd/yyy, price 1
stock, mm/dd/yyy, price 2
.
.
.
stock, mm/dd/yyy, price D
Output:
The sample output will simply contain either:- the amount of money you have
- or the value of the stock you are holding for each stock, each day entered.
This will have the form of:
My capital is 99999.99
My stock is 99999.99
SAMPLE INPUT:
3
2
13
13
10000.00
ACME 09/01/012 100
ACME 09/02/012 200
ACME 09/03/012 300
ACME 09/04/012 200
ACME 09/05/012 400
ACME 09/06/012 400
ACME 09/07/012 400
ACME 09/08/012 400
ACME 09/09/012 400
ACME 09/10/012 400
ACME 09/11/012 400
ACME 09/12/012 400
ACME 09/13/012 0
2
5
5
30000.00
ACME 09/14/012 400
ACME 09/15/012 1000
ACME 09/06/012 678
ACME 09/17/012 75
ACME 09/18/012 29
2
9
9
5000.00
ACME 09/14/012 712
ACME 09/15/012 713
ACME 09/06/012 713
ACME 09/17/012 710
ACME 09/18/012 709
ACME 09/14/012 709
ACME 09/15/012 708
ACME 09/06/012 708
ACME 09/17/012 500
SAMPLE OUTPUT:
My capital is 10000.0
My capital is 30000.0
My capital is 5000.0